Note
Go to the end to download the full example code
Compute the explainable variance
Before fitting any voxelwise model to fMRI responses, it is good practice to quantify the amount of signal in the test set that can be predicted by an encoding model. This quantity is called the explainable variance.
The measured signal can be decomposed into a sum of two components: the stimulus-dependent signal and noise. If we present the same stimulus multiple times and we record brain activity for each repetition, the stimulus-dependent signal will be the same across repetitions while the noise will vary across repetitions. In voxelwise modeling, the features used to model brain activity are the same for each repetition of the stimulus. Thus, encoding models will predict only the repeatable stimulus-dependent signal.
The stimulus-dependent signal can be estimated by taking the mean of brain responses over repeats of the same stimulus or experiment. The variance of the estimated stimulus-dependent signal, which we call the explainable variance, is proportional to the maximum prediction accuracy that can be obtained by a voxelwise encoding model in the test set.
Mathematically, let \(y_i, i = 1 \dots N\) be the measured signal in a voxel for each of the \(N\) repetitions of the same stimulus and \(\bar{y} = \frac{1}{N}\sum_{i=1}^Ny_i\) the average brain response across repetitions. For each repeat, we define the residual timeseries between brain response and average brain response as \(r_i = y_i - \bar{y}\). The explainable variance (EV) is estimated as
In the literature, the explainable variance is also known as the signal power. For more information, see these references [1] [2] [3].
Path of the data directory
from voxelwise_tutorials.io import get_data_home

directory = get_data_home(dataset="shortclips")
print(directory)
/home/jlg/mvdoc/voxelwise_tutorials_data/shortclips
# modify to use another subject
subject = "S01"
Compute the explainable variance
import numpy as np
from voxelwise_tutorials.io import load_hdf5_array
First, we load the fMRI responses on the test set, which contains brain responses to ten (10) repeats of the same stimulus.
import os

file_name = os.path.join(directory, 'responses', f'{subject}_responses.hdf')
Y_test = load_hdf5_array(file_name, key="Y_test")
print("(n_repeats, n_samples_test, n_voxels) =", Y_test.shape)
(n_repeats, n_samples_test, n_voxels) = (10, 270, 84038)
Then, we compute the explainable variance for each voxel.
from voxelwise_tutorials.utils import explainable_variance

ev = explainable_variance(Y_test)
print("(n_voxels,) =", ev.shape)
(n_voxels,) = (84038,)
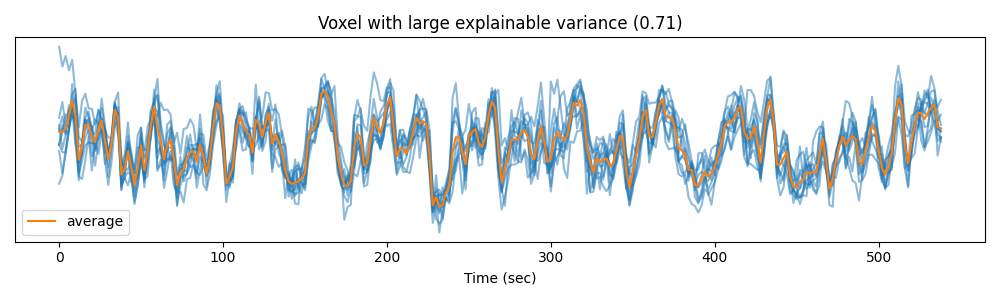
To better understand the concept of explainable variance, we can plot the measured signal in a voxel with high explainable variance…
import matplotlib.pyplot as plt

voxel_1 = np.argmax(ev)
time = np.arange(Y_test.shape[1]) * 2  # one time point every 2 seconds
plt.figure(figsize=(10, 3))
plt.plot(time, Y_test[:, :, voxel_1].T, color='C0', alpha=0.5)
plt.plot(time, Y_test[:, :, voxel_1].mean(0), color='C1', label='average')
plt.xlabel("Time (sec)")
plt.title("Voxel with large explainable variance (%.2f)" % ev[voxel_1])
plt.yticks([])
plt.legend()
plt.tight_layout()
plt.show()
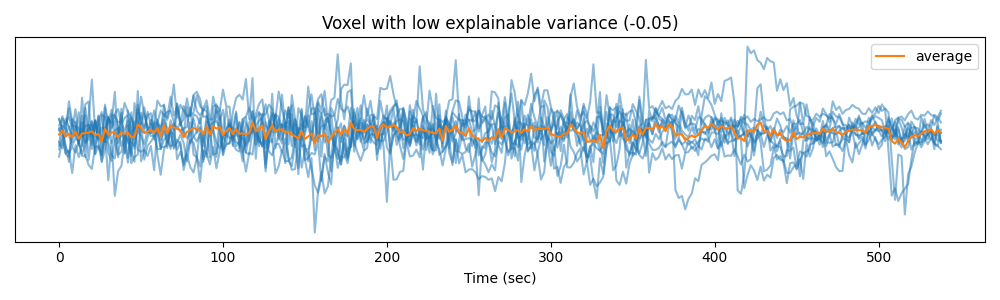
… and in a voxel with low explainable variance.
voxel_2 = np.argmin(ev)
plt.figure(figsize=(10, 3))
plt.plot(time, Y_test[:, :, voxel_2].T, color='C0', alpha=0.5)
plt.plot(time, Y_test[:, :, voxel_2].mean(0), color='C1', label='average')
plt.xlabel("Time (sec)")
plt.title("Voxel with low explainable variance (%.2f)" % ev[voxel_2])
plt.yticks([])
plt.legend()
plt.tight_layout()
plt.show()
We can also plot the distribution of explainable variance over voxels.
plt.hist(ev, bins=np.linspace(0, 1, 100), log=True, histtype='step')
plt.xlabel("Explainable variance")
plt.ylabel("Number of voxels")
plt.title('Histogram of explainable variance')
plt.grid('on')
plt.show()
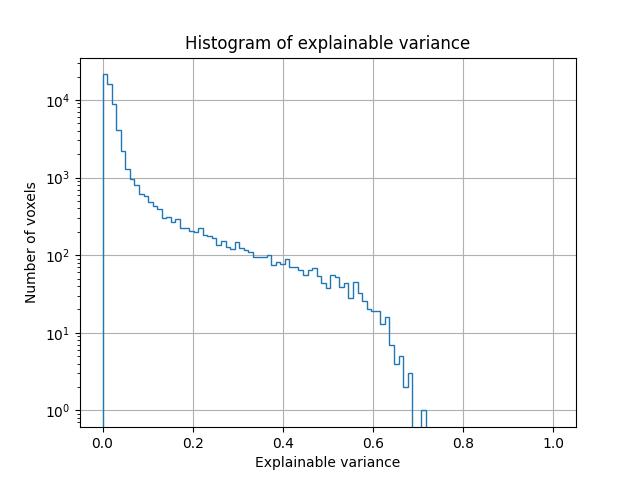
We see that many voxels have low explainable variance. This is expected, since many voxels are not driven by a visual stimulus, and their response changes over repeats of the same stimulus. We also see that some voxels have high explainable variance (around 0.7). The responses in these voxels are highly consistent across repetitions of the same stimulus. Thus, they are good targets for encoding models.
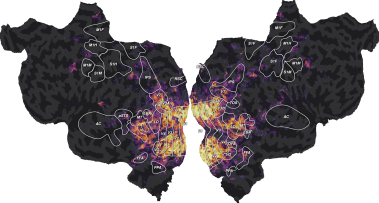
Map to subject flatmap
To better understand the distribution of explainable variance, we map the
values to the subject brain. This can be done with pycortex, which can create interactive 3D
viewers to be displayed in any modern browser. pycortex can also display
flattened maps of the cortical surface to visualize the entire cortical
surface at once.
Here, we do not share the anatomical information of the subjects for privacy concerns. Instead, we provide two mappers:
to map the voxels to a (subject-specific) flatmap
to map the voxels to the Freesurfer average cortical surface (“fsaverage”)
The first mapper is 2D matrix of shape (n_pixels, n_voxels) that maps each
voxel to a set of pixel in a flatmap. The matrix is efficiently stored in a
scipy sparse CSR matrix. The function plot_flatmap_from_mapper
provides an example of how to use the mapper and visualize the flatmap.
from voxelwise_tutorials.viz import plot_flatmap_from_mapper

mapper_file = os.path.join(directory, 'mappers', f'{subject}_mappers.hdf')
plot_flatmap_from_mapper(ev, mapper_file, vmin=0, vmax=0.7)
plt.show()
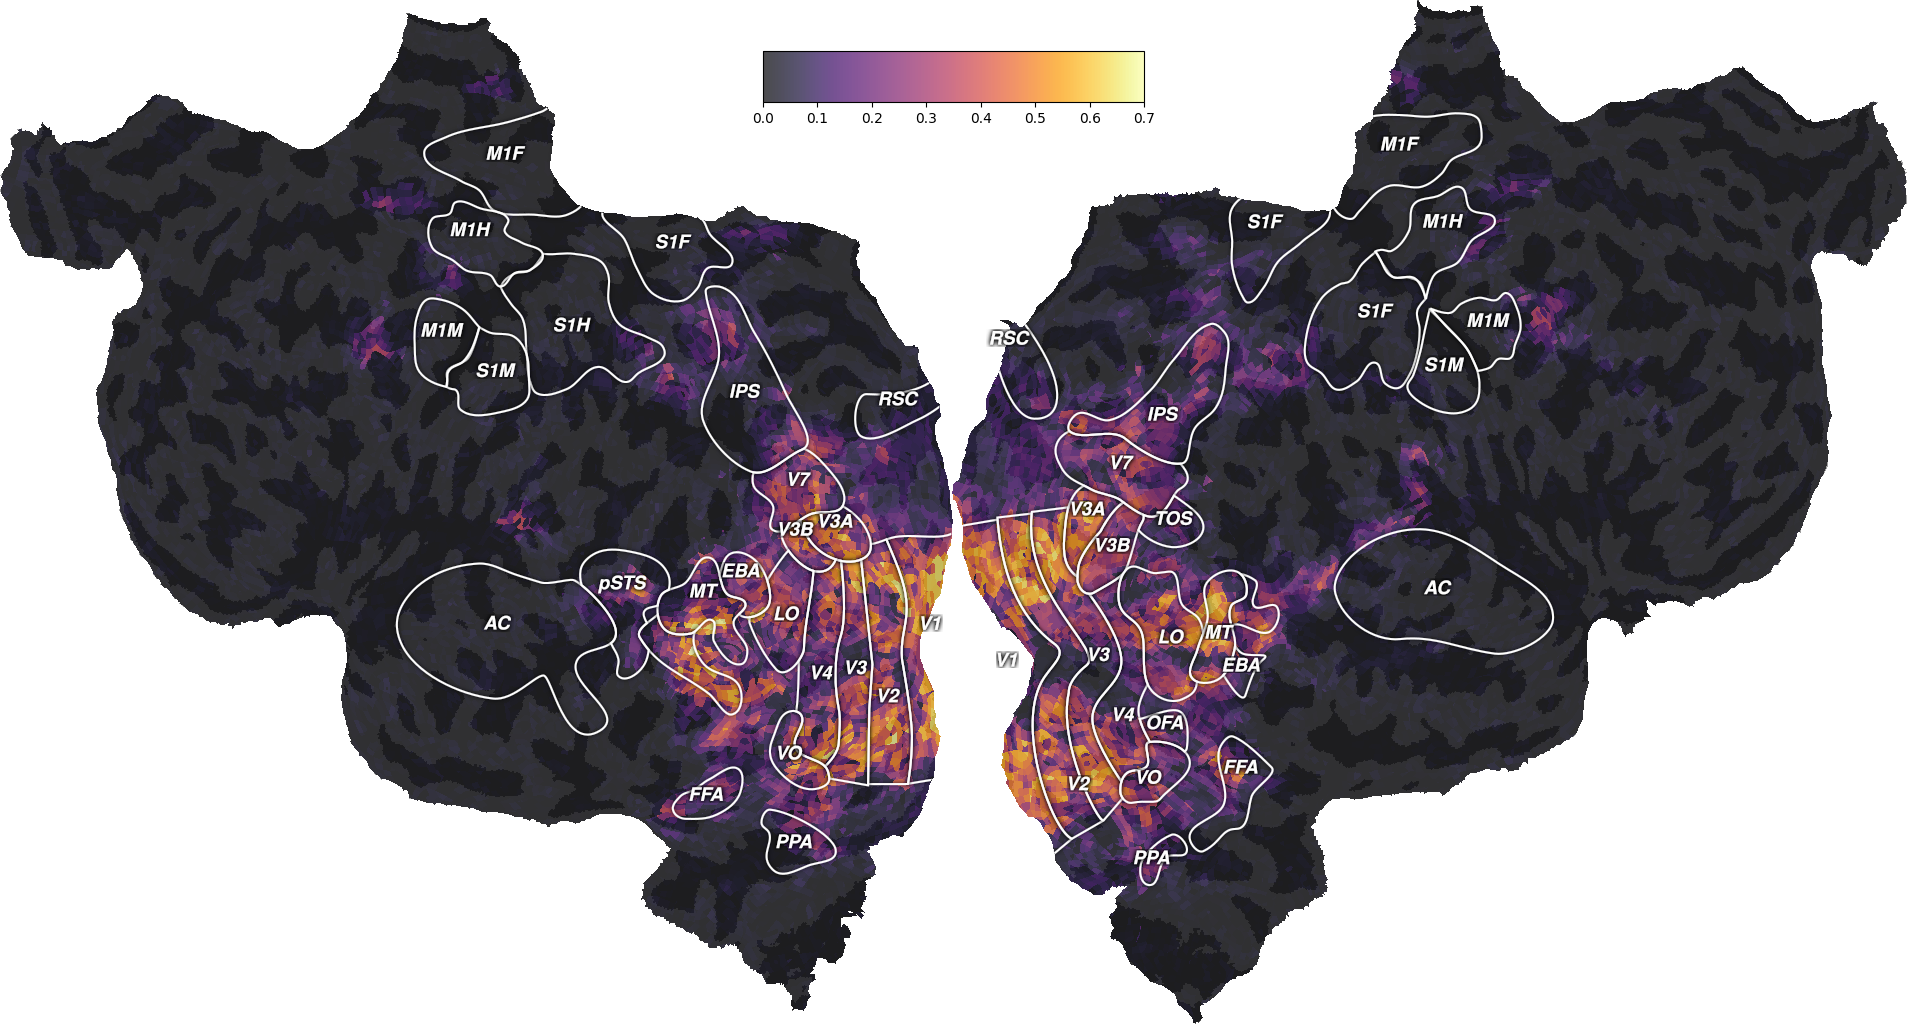
This figure is a flattened map of the cortical surface. A number of regions
of interest (ROIs) have been labeled to ease interpretation. If you have
never seen such a flatmap, we recommend taking a look at a pycortex brain
viewer, which displays
the brain in 3D. In this viewer, press “I” to inflate the brain, “F” to
flatten the surface, and “R” to reset the view (or use the surface/unfold
cursor on the right menu). Press “H” for a list of all keyboard shortcuts.
This viewer should help you understand the correspondence between the flatten
and the folded cortical surface of the brain.
On this flatmap, we can see that the explainable variance is mainly located in the visual cortex, in early visual regions like V1, V2, V3, or in higher-level regions like EBA, FFA or IPS. This is expected since this dataset contains responses to a visual stimulus.
Map to “fsaverage”
The second mapper we provide maps the voxel data to a Freesurfer
average surface (“fsaverage”), that can be used in pycortex.
First, let’s download the “fsaverage” surface.
import cortex

surface = "fsaverage"

if not hasattr(cortex.db, surface):
    cortex.utils.download_subject(subject_id=surface,
                                  pycortex_store=cortex.db.filestore)
    cortex.db.reload_subjects()  # force filestore reload
    assert hasattr(cortex.db, surface)
Then, we load the “fsaverage” mapper. The mapper is a matrix of shape
(n_vertices, n_voxels), which maps each voxel to some vertices in the
fsaverage surface. It is stored as a sparse CSR matrix. The mapper is applied
with a dot product @ (equivalent to np.dot).
from voxelwise_tutorials.io import load_hdf5_sparse_array

voxel_to_fsaverage = load_hdf5_sparse_array(mapper_file,
                                            key='voxel_to_fsaverage')
ev_projected = voxel_to_fsaverage @ ev
print("(n_vertices,) =", ev_projected.shape)
(n_vertices,) = (327684,)
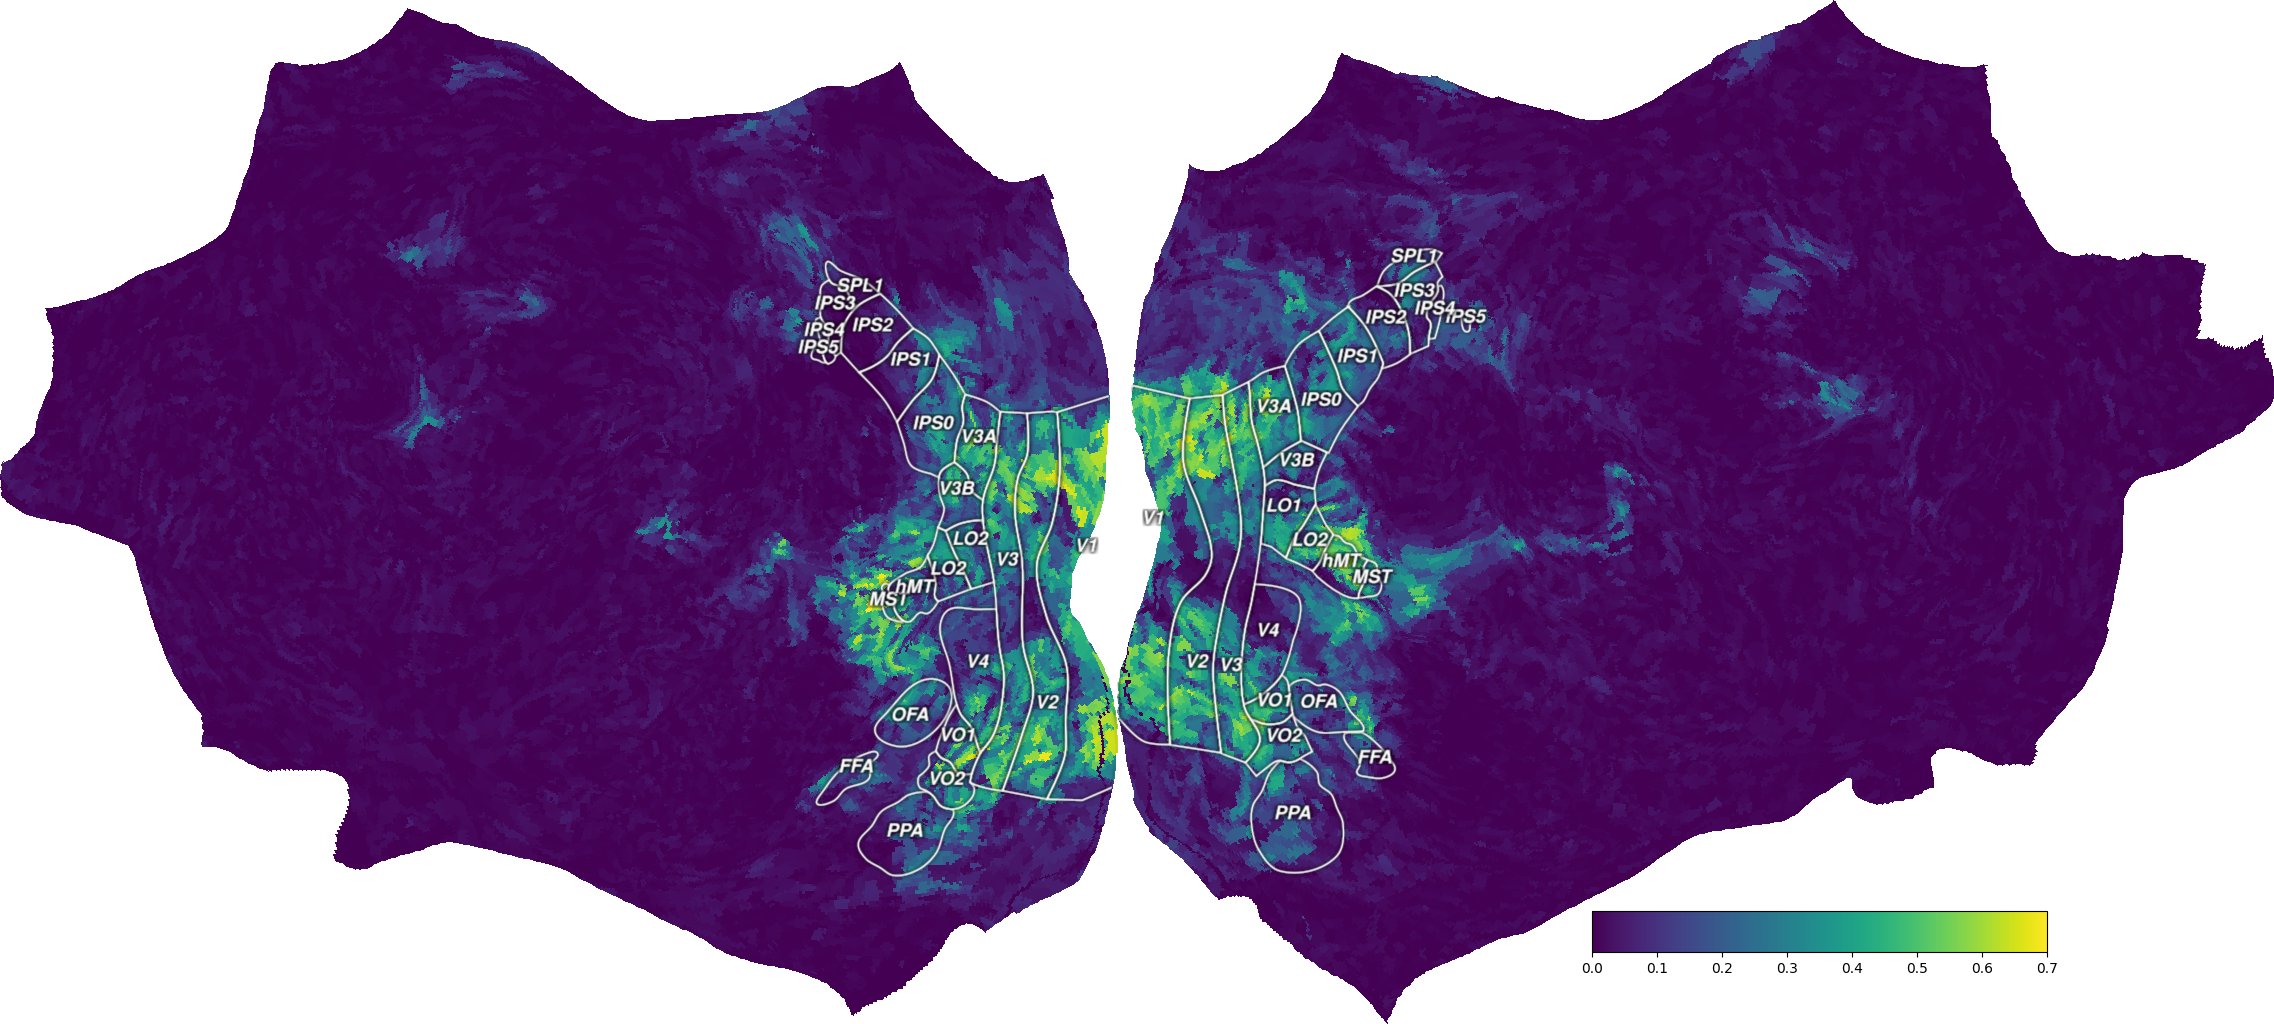
We can then create a Vertex object in pycortex, containing the
projected data. This object can be used either in a pycortex interactive
3D viewer, or in a matplotlib figure showing only the flatmap.
vertex = cortex.Vertex(ev_projected, surface, vmin=0, vmax=0.7, cmap='viridis')
To start an interactive 3D viewer in the browser, we can use the webshow
function in pycortex. (Note that this method works only if you are running the
notebooks locally.) You can start an interactive 3D viewer by changing
run_webshow to True and running the following cell.
run_webshow = False
if run_webshow:
    cortex.webshow(vertex, open_browser=False, port=8050)
Alternatively, to plot a flatmap in a matplotlib figure, use the
quickshow function.
(This function requires Inkscape to be installed. The rest of the tutorial does not use this function, so feel free to ignore.)
from cortex.testing_utils import has_installed

fig = cortex.quickshow(vertex, colorbar_location='right',
                       with_rois=has_installed("inkscape"))
plt.show()
References
Total running time of the script: (0 minutes 28.850 seconds)