Note
Go to the end to download the full example code
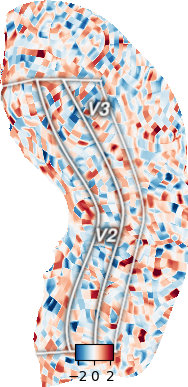
Plot cutouts on the flatmap
Cutouts are manually generated cuts of the cortical surface to highlight a region of interest.
Cutouts are defined as sub-layers of the cutouts layer in <filestore>/<subject>/overlays.svg.
The parameter cutout of the quickflat.make_figure method should be the name of the flatmap cutout defined in the overlays.svg file.
Background RRGGBBAA: ffffff00
Area 0:0:1960.5:1024 exported to 1960 x 1024 pixels (96 dpi)
Background RRGGBBAA: ffffff00
Area 0:0:1960.5:1024 exported to 1960 x 1024 pixels (96 dpi)
import cortex
import numpy as np
np.random.seed(1234)

# Name of a sub-layer of the 'cutouts' layer in overlays.svg file
cutout_name = "VisualCortexRight"

# Create a random pycortex Volume
volume = cortex.Volume.random(subject='S1', xfmname='fullhead')

# Plot a flatmap with the data projected onto the surface
# Highlight the curvature and which cutout to be displayed
_ = cortex.quickflat.make_figure(volume,
                                 with_curvature=True,
                                 cutout=cutout_name)
Total running time of the script: (0 minutes 1.811 seconds)