Note
Click here to download the full example code
Plot ROIs on the flatmap
ROIs are defined as sub-layers of the roi layer in <filestore>/<subject>/overlays.svg
By default, ROIs and ROI labels are displayed when a flatmap is plotted using quickflat.make_figure.
with_labels=False turns off the ROI labels. with_rois=False turns off the ROI display.
Out:
Failed to get connection
** (inkscape:5256): CRITICAL **: 01:28:06.354: dbus_g_proxy_new_for_name: assertion 'connection != NULL' failed
** (inkscape:5256): CRITICAL **: 01:28:06.354: dbus_g_proxy_call: assertion 'DBUS_IS_G_PROXY (proxy)' failed
** (inkscape:5256): CRITICAL **: 01:28:06.354: dbus_g_connection_register_g_object: assertion 'connection != NULL' failed
Failed to get connection
** (inkscape:5260): CRITICAL **: 01:28:07.392: dbus_g_proxy_new_for_name: assertion 'connection != NULL' failed
** (inkscape:5260): CRITICAL **: 01:28:07.392: dbus_g_proxy_call: assertion 'DBUS_IS_G_PROXY (proxy)' failed
** (inkscape:5260): CRITICAL **: 01:28:07.392: dbus_g_connection_register_g_object: assertion 'connection != NULL' failed
import cortex
import numpy as np
import matplotlib.pyplot as plt
np.random.seed(1234)
# Create a random pycortex Volume
volume = cortex.Volume.random(subject='S1', xfmname='fullhead')
# Plot a flatmap with the data projected onto the surface
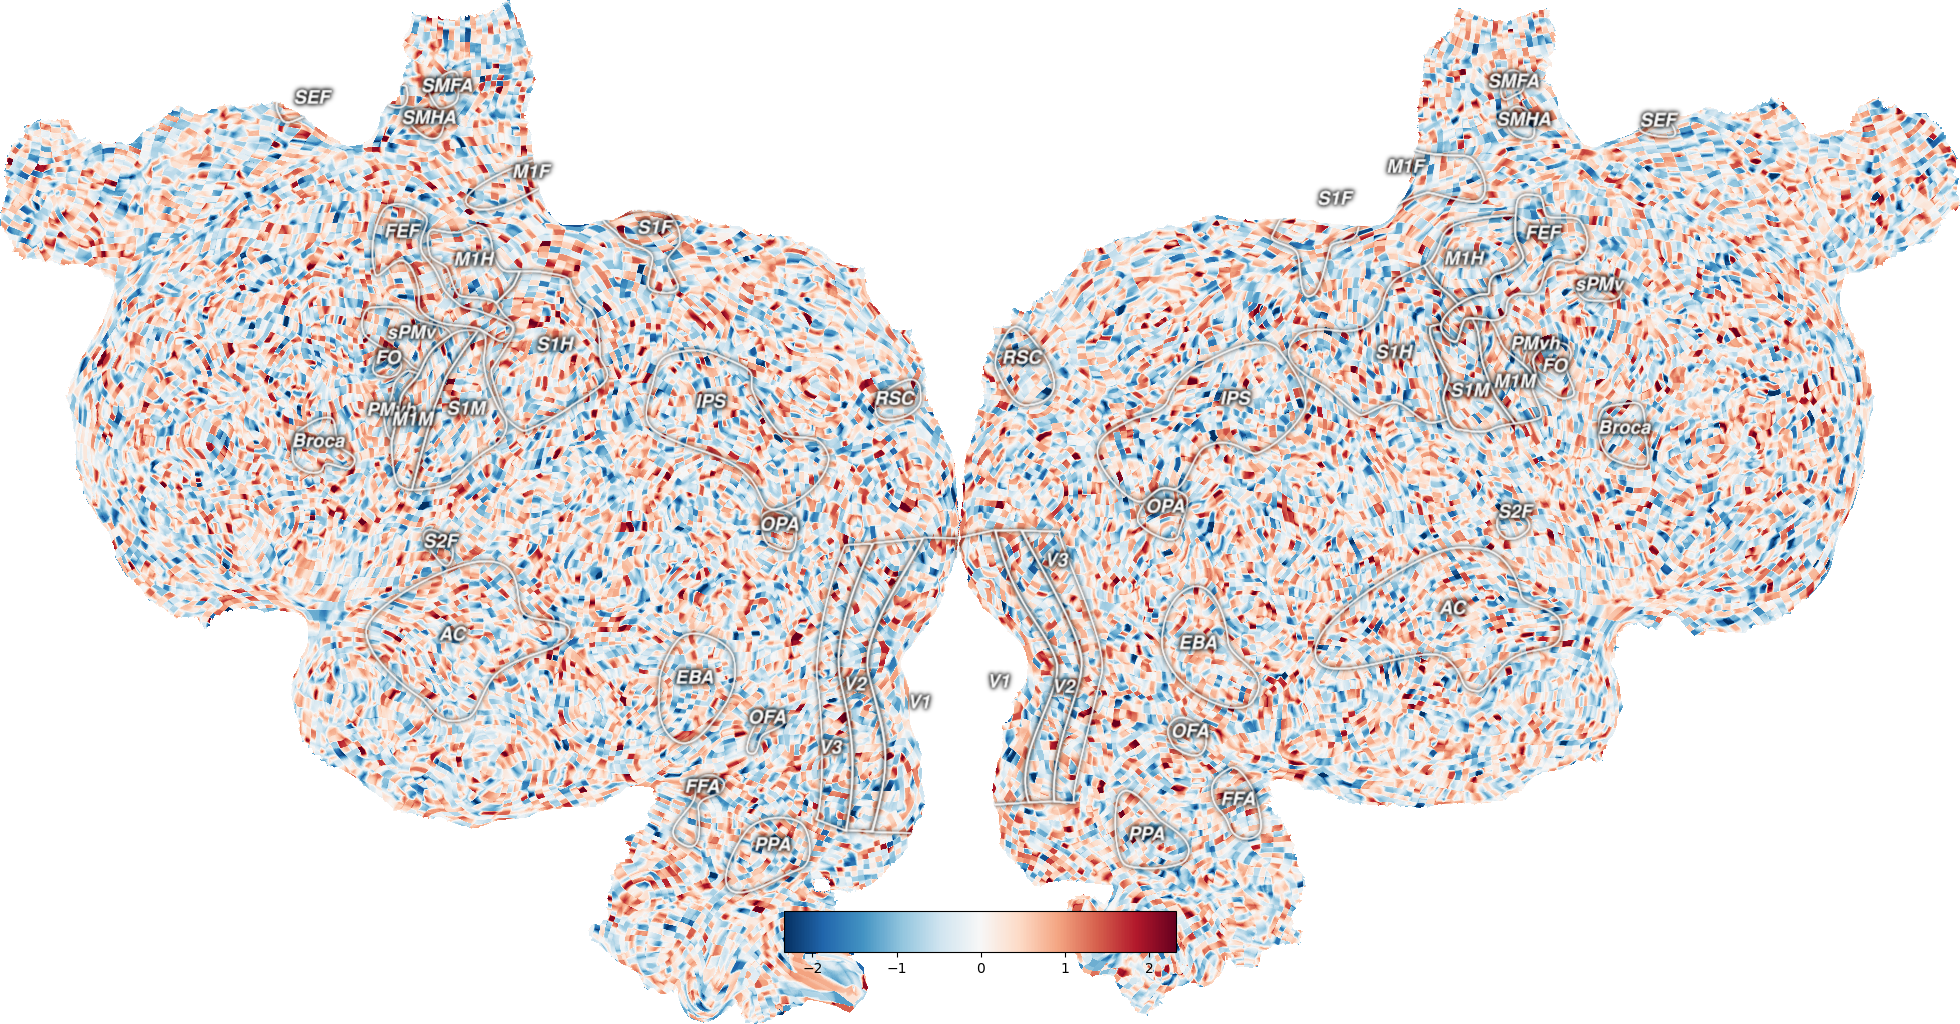
# By default the ROIs and their labels will be displayed
_ = cortex.quickflat.make_figure(volume)
plt.show()
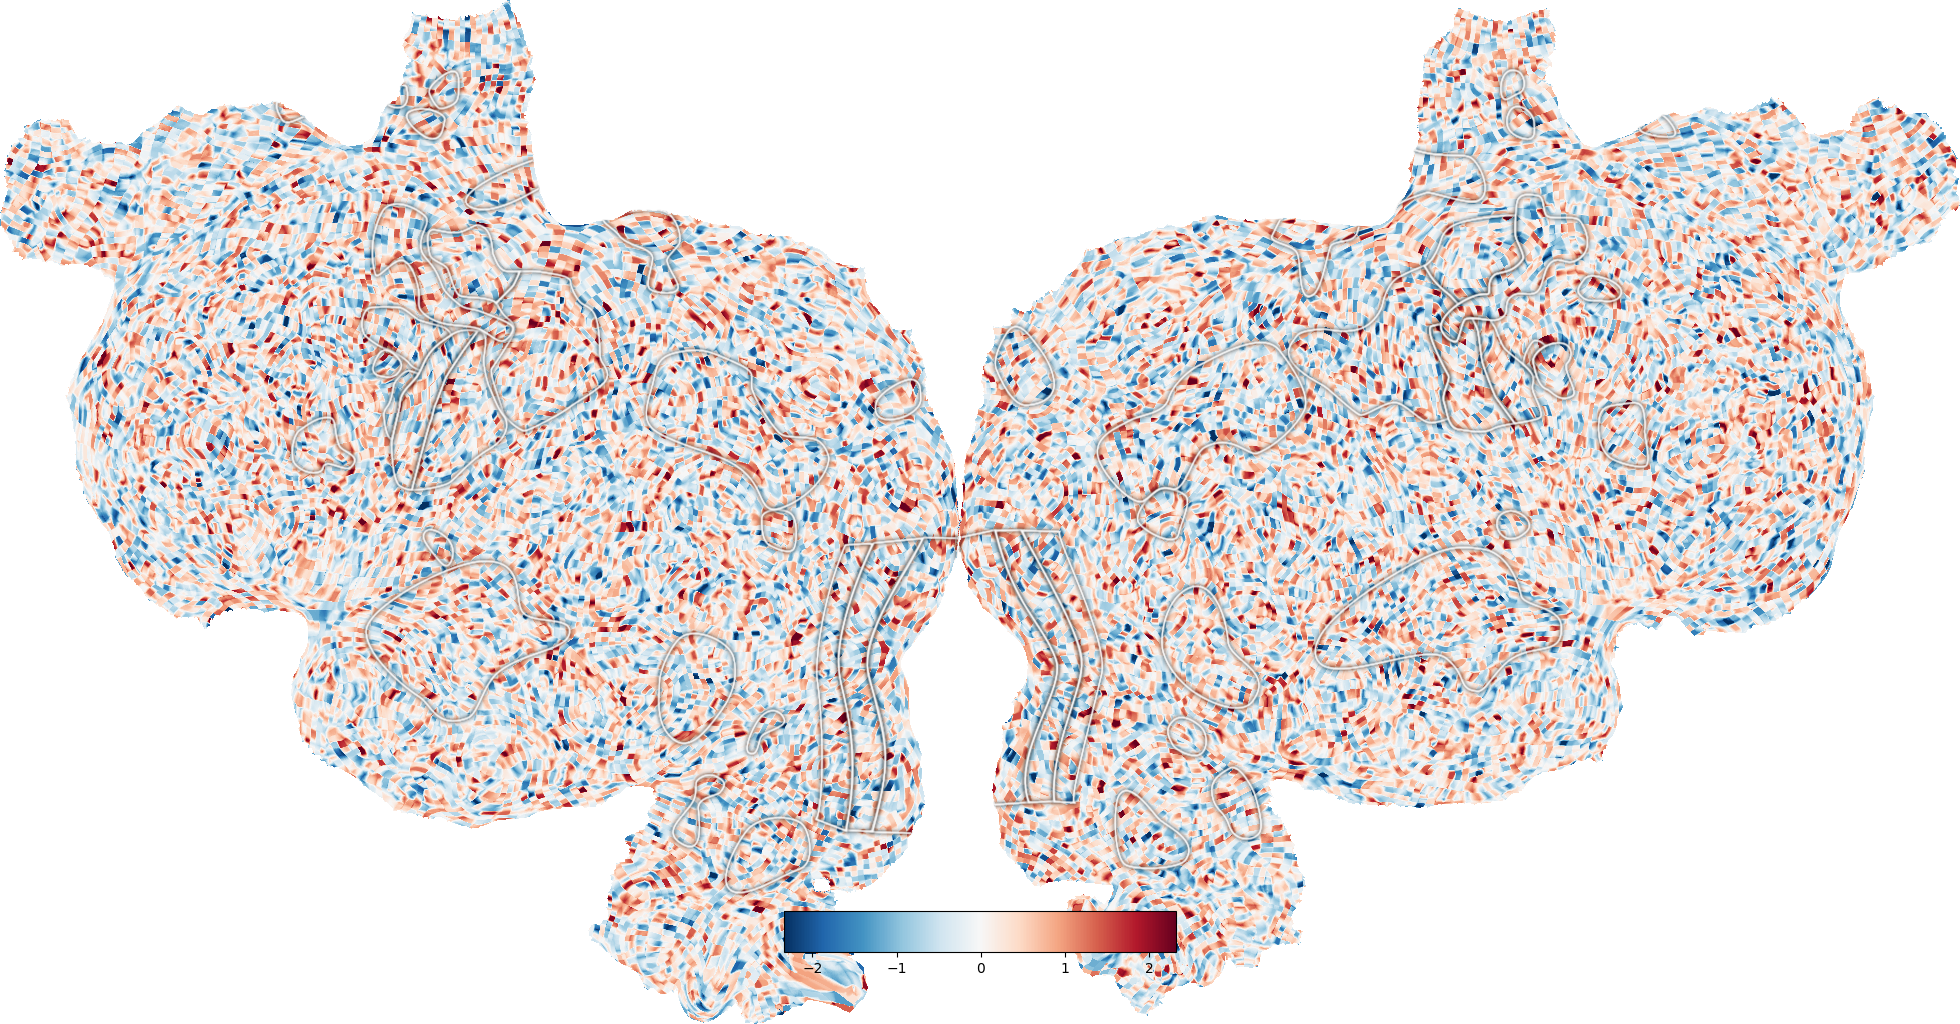
# Turn off the ROI labels
_ = cortex.quickflat.make_figure(volume, with_labels=False)
plt.show()
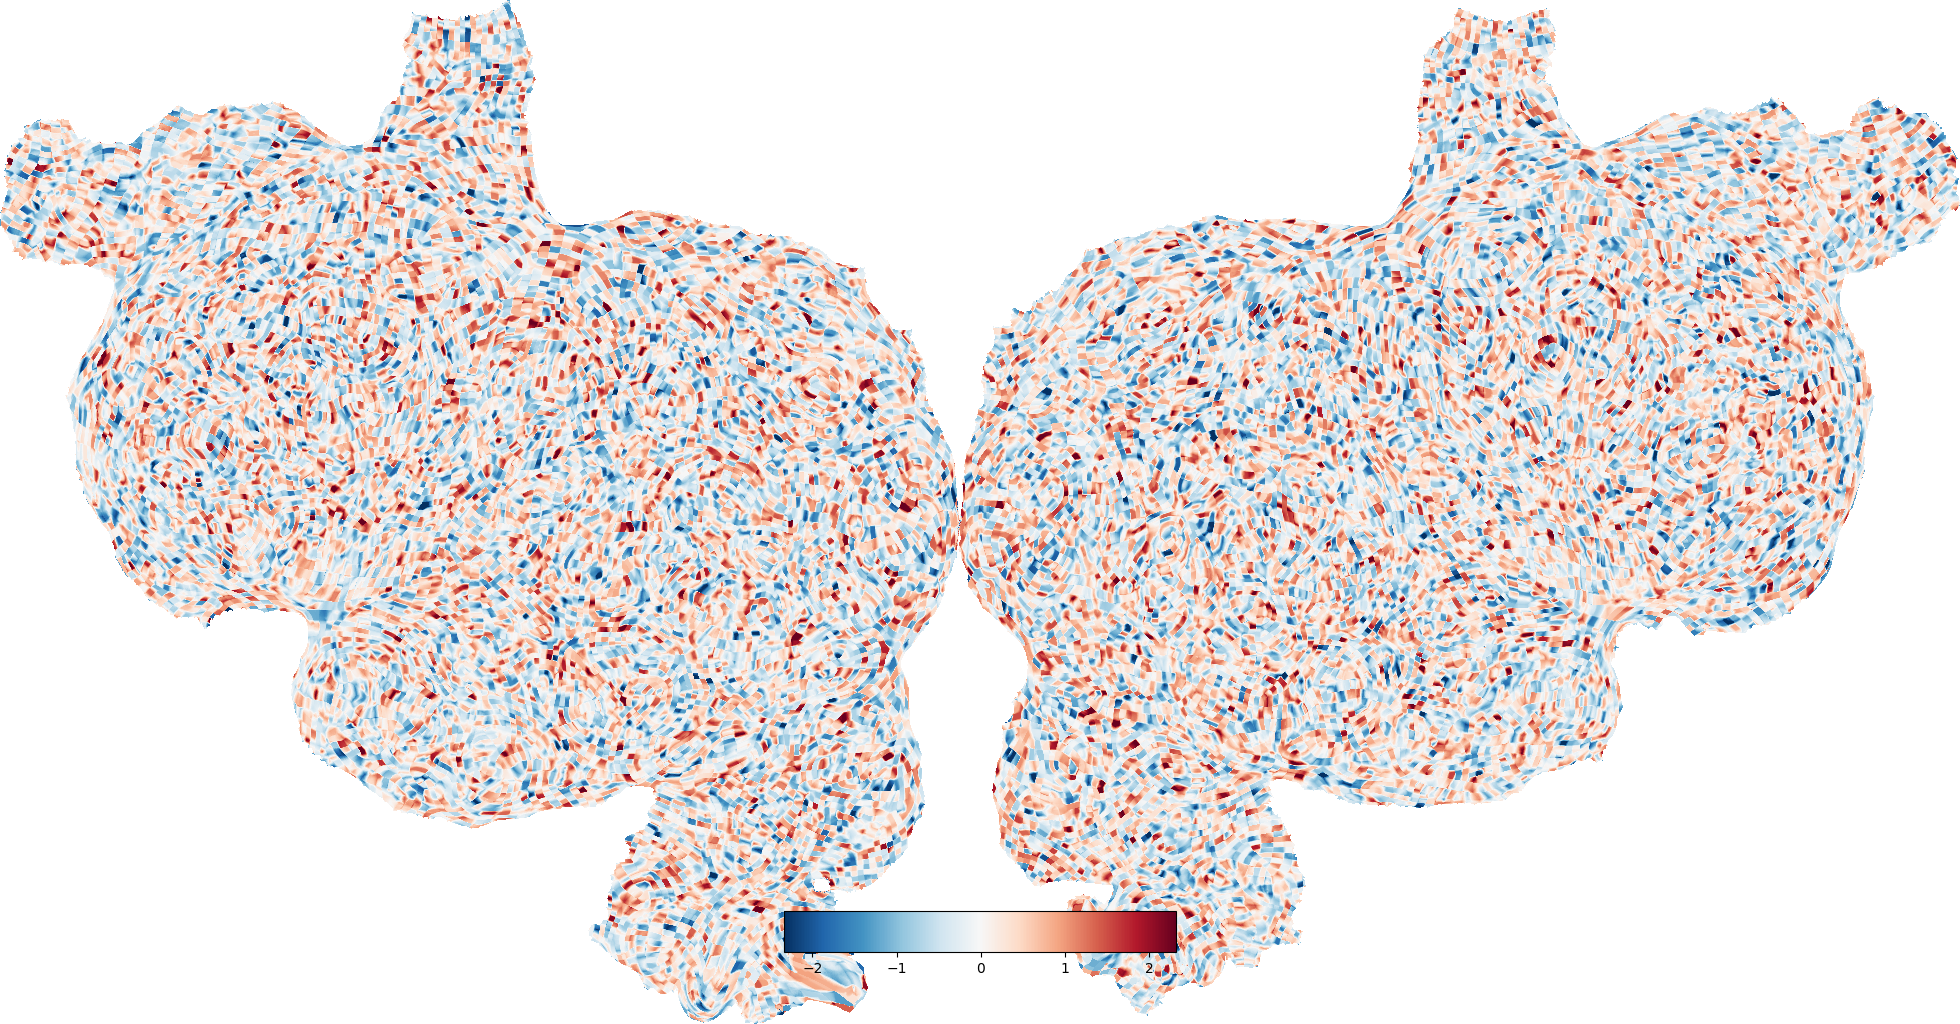
# Turn off the ROIs
_ = cortex.quickflat.make_figure(volume, with_rois=False)
plt.show()
Total running time of the script: ( 0 minutes 5.128 seconds)