Note
Go to the end to download the full example code
Plot and Use Subsurface Tools
Subsurfaces can be used for efficient operations on subsets of cortical surface
import tempfile

import matplotlib.pyplot as plt
import numpy as np

import cortex.polyutils


subject = 'S1'

left, right = cortex.db.get_surf(subject, 'fiducial')
left_surface = cortex.polyutils.Surface(left[0], left[1])
right_surface = cortex.polyutils.Surface(right[0], right[1])
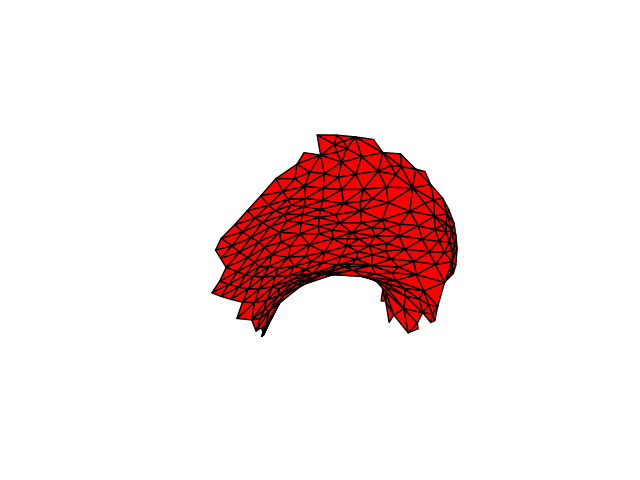
create subsurface
center = 125000
radius = 7

patch = left_surface.get_geodesic_patch(center, radius=radius)
subsurface = left_surface.create_subsurface(vertex_mask=patch['vertex_mask'])
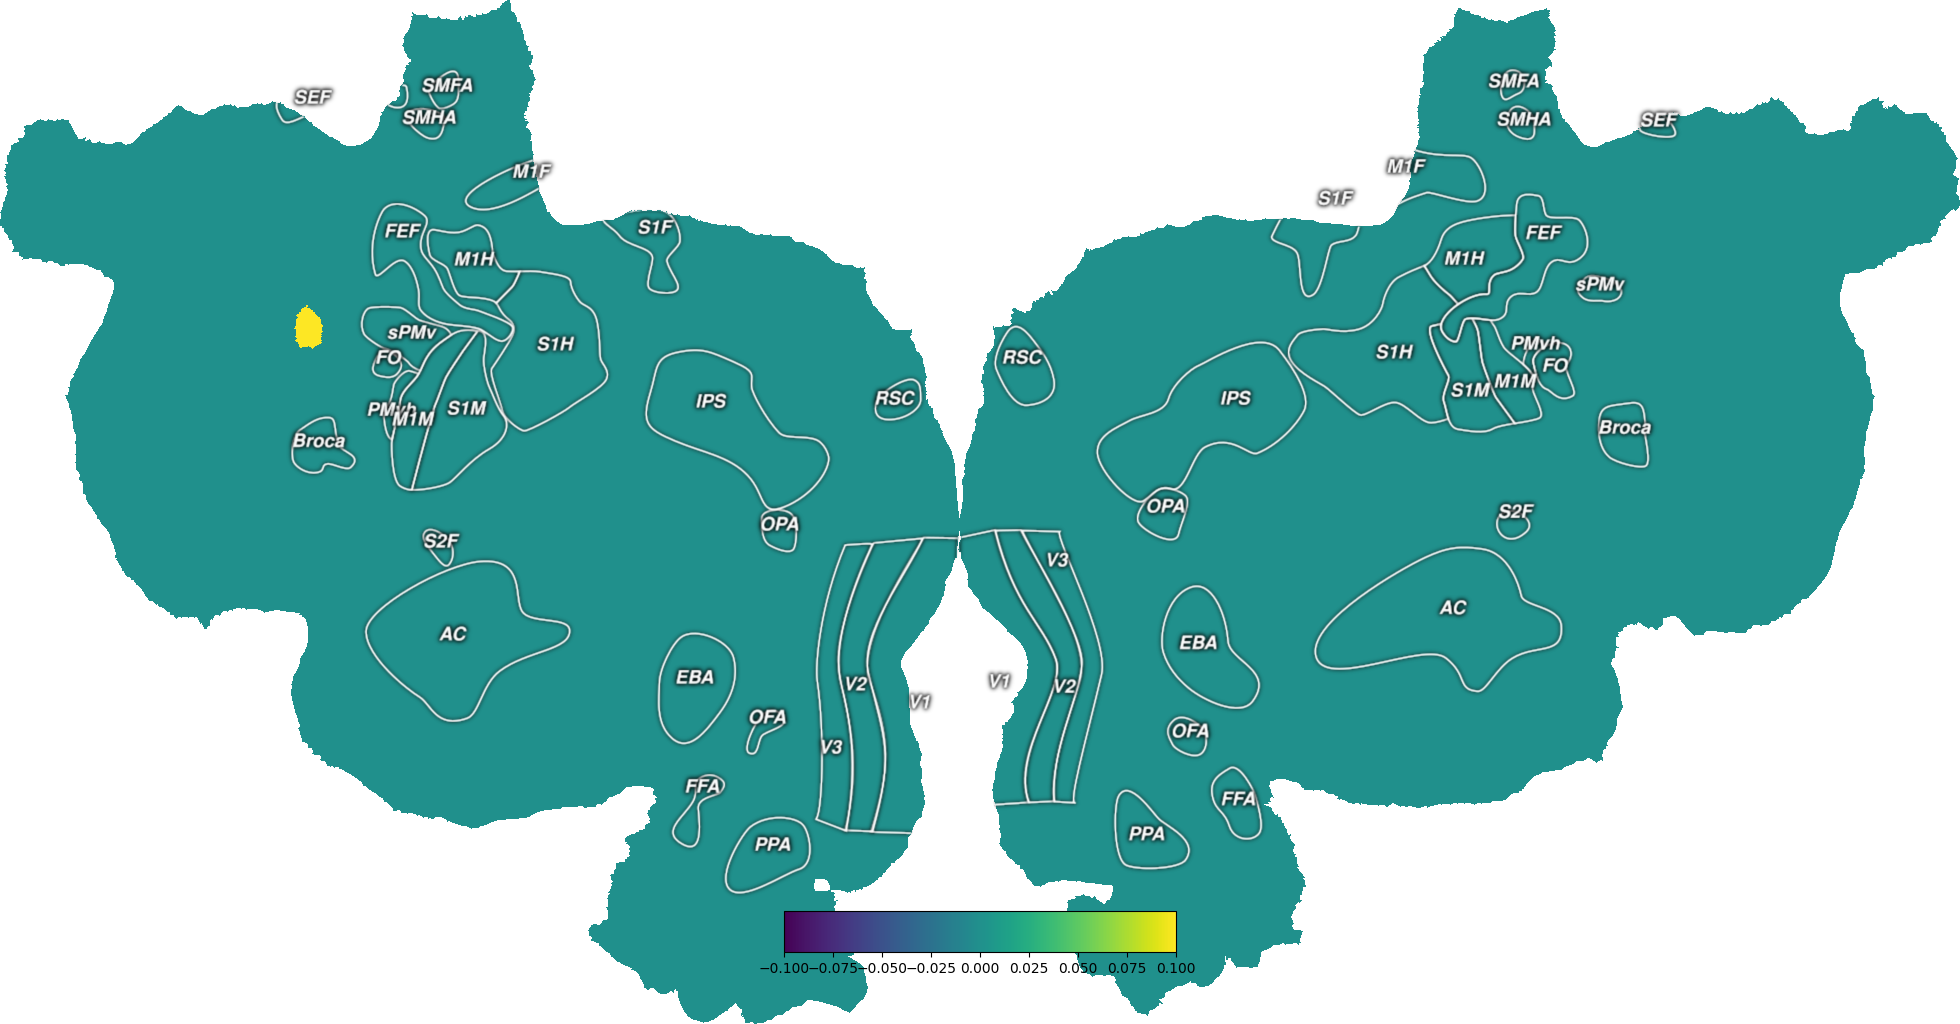
plot data on subsurface
data = subsurface.geodesic_distance([0]) + 20
dataset = cortex.Vertex(subsurface.lift_subsurface_data(data), subject, cmap='viridis')
cortex.quickshow(dataset)
plt.title('example subsurface data')
plt.show()
Background RRGGBBAA: ffffff00
Area 0:0:1960.5:1024 exported to 1960 x 1024 pixels (96 dpi)
plot subsurface as gif
f, path = tempfile.mkstemp()
path = path + '.gif'
# subsurface.plot_subsurface_rotating_gif(path=path)
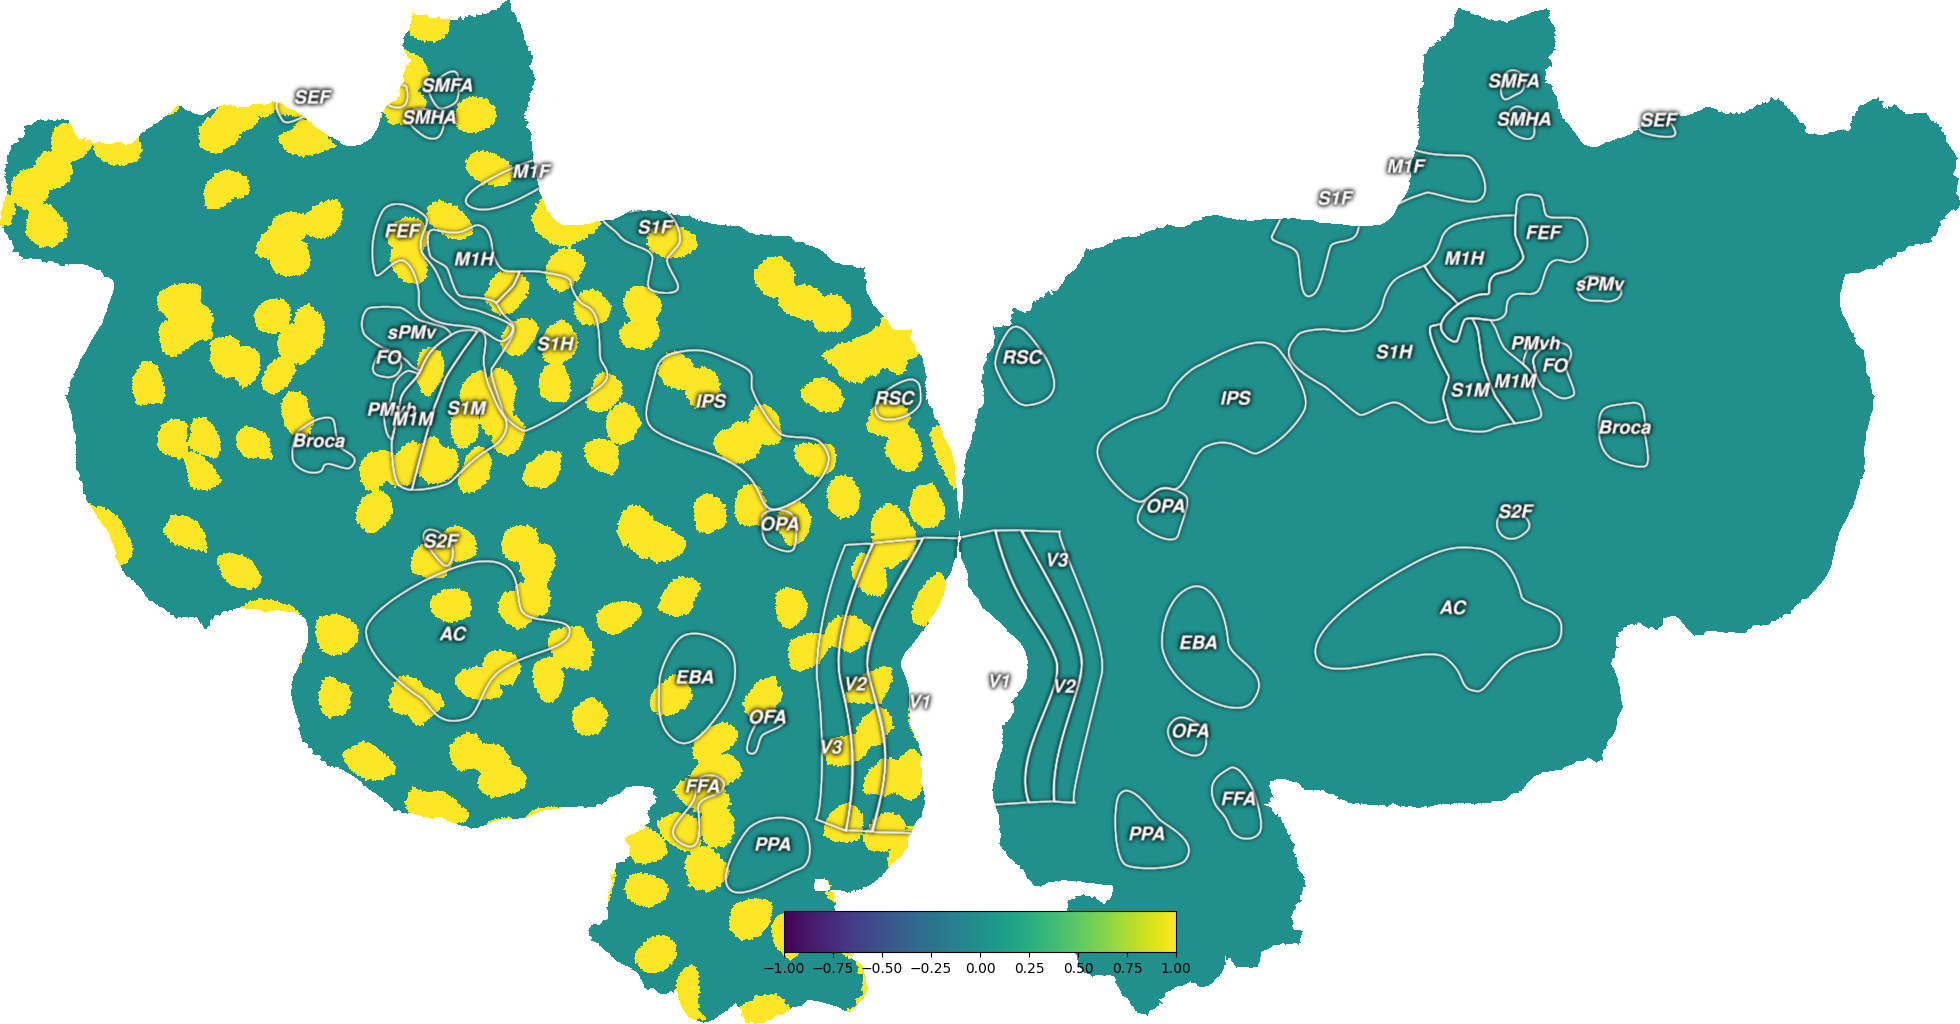
create many patches
patches = left_surface.get_geodesic_patches(
    seeds=np.arange(0, 150000, 1000),
    radius=8,
)

dataset = cortex.Vertex(
    patches['vertex_masks'].sum(0),
    subject,
    cmap='viridis',
    vmin=-1,
    vmax=1,
)
cortex.quickshow(dataset)
plt.title('patches')
plt.show()
Background RRGGBBAA: ffffff00
Area 0:0:1960.5:1024 exported to 1960 x 1024 pixels (96 dpi)
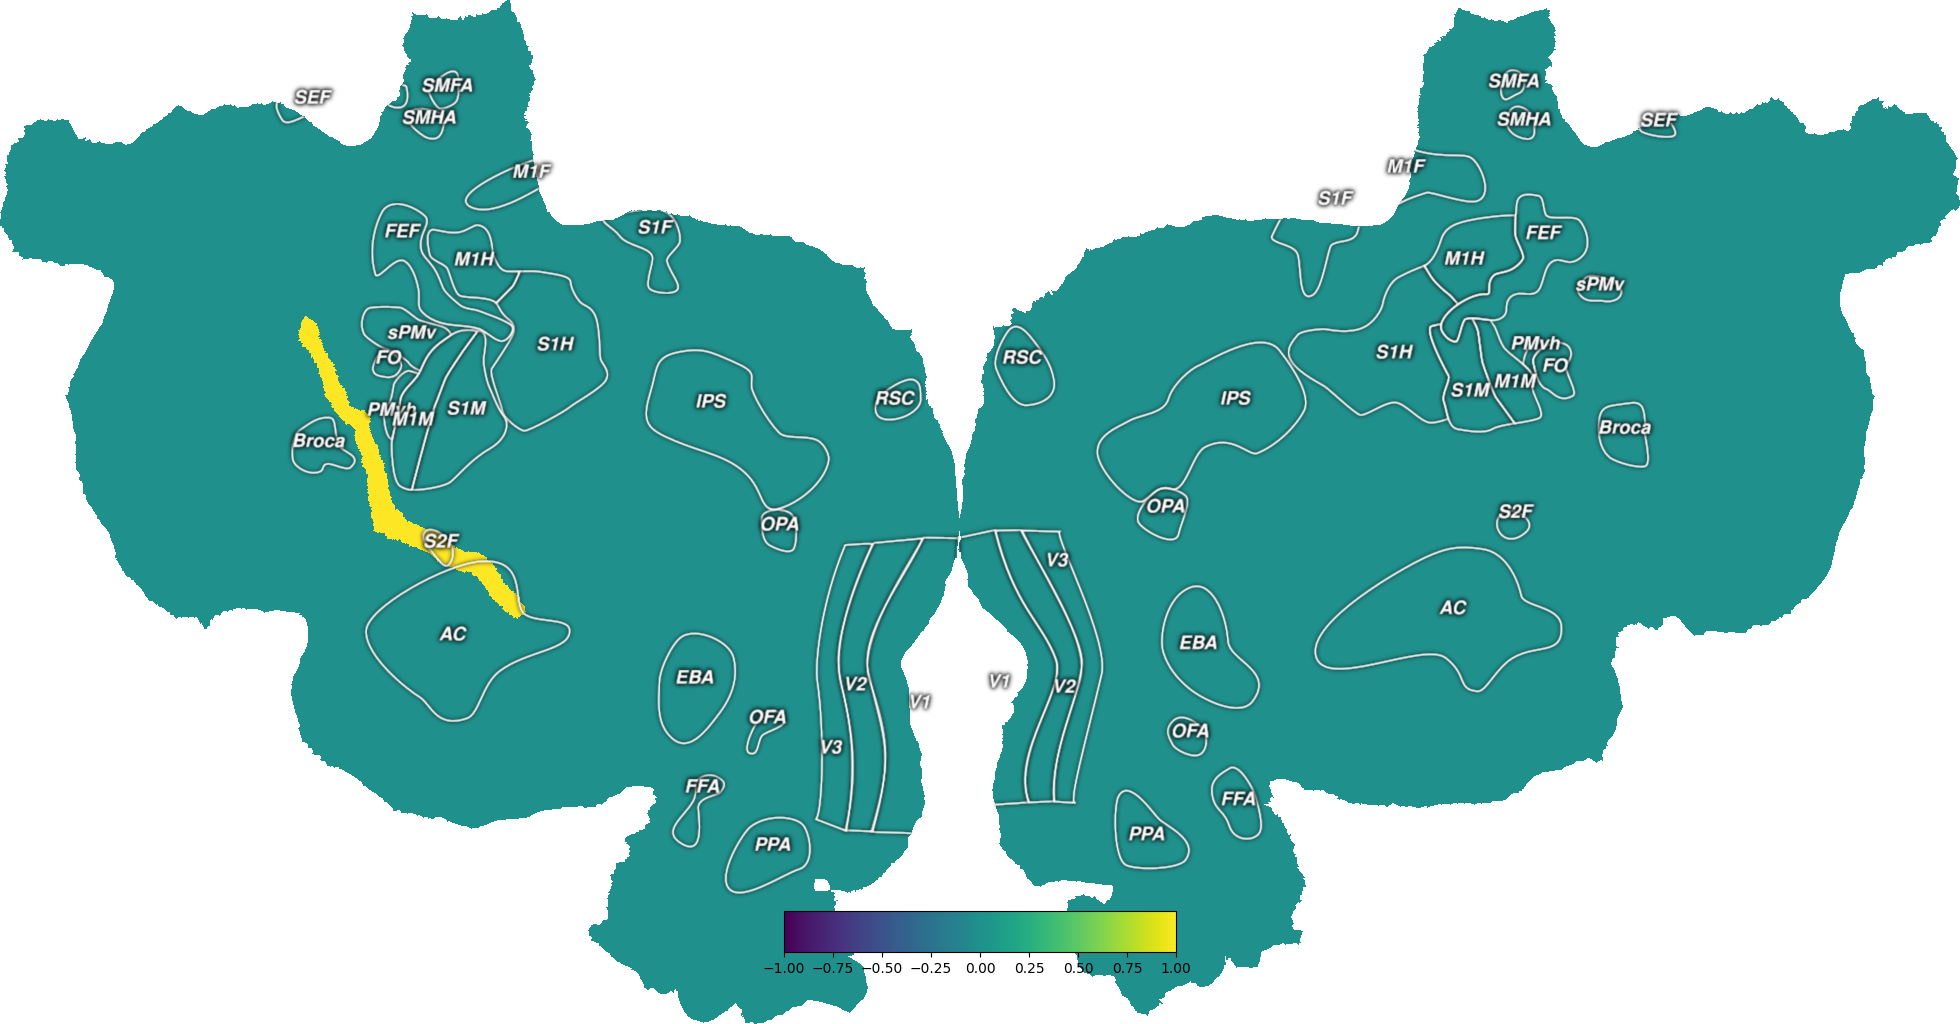
create geodesic strip patch
patch = left_surface.get_geodesic_strip_patch(v0=70000, v1=125000, radius=5)
dataset = cortex.Vertex(patch['vertex_mask'], subject, vmin=-1, vmax=1, cmap='viridis')
cortex.quickshow(dataset)
plt.title('strip patch')
plt.show()
dataset = cortex.Vertex(patch['coordinates'][0, :], subject, cmap='viridis')
cortex.quickshow(dataset)
plt.title('first coordinate, distance along central geodesic axis')
plt.show()
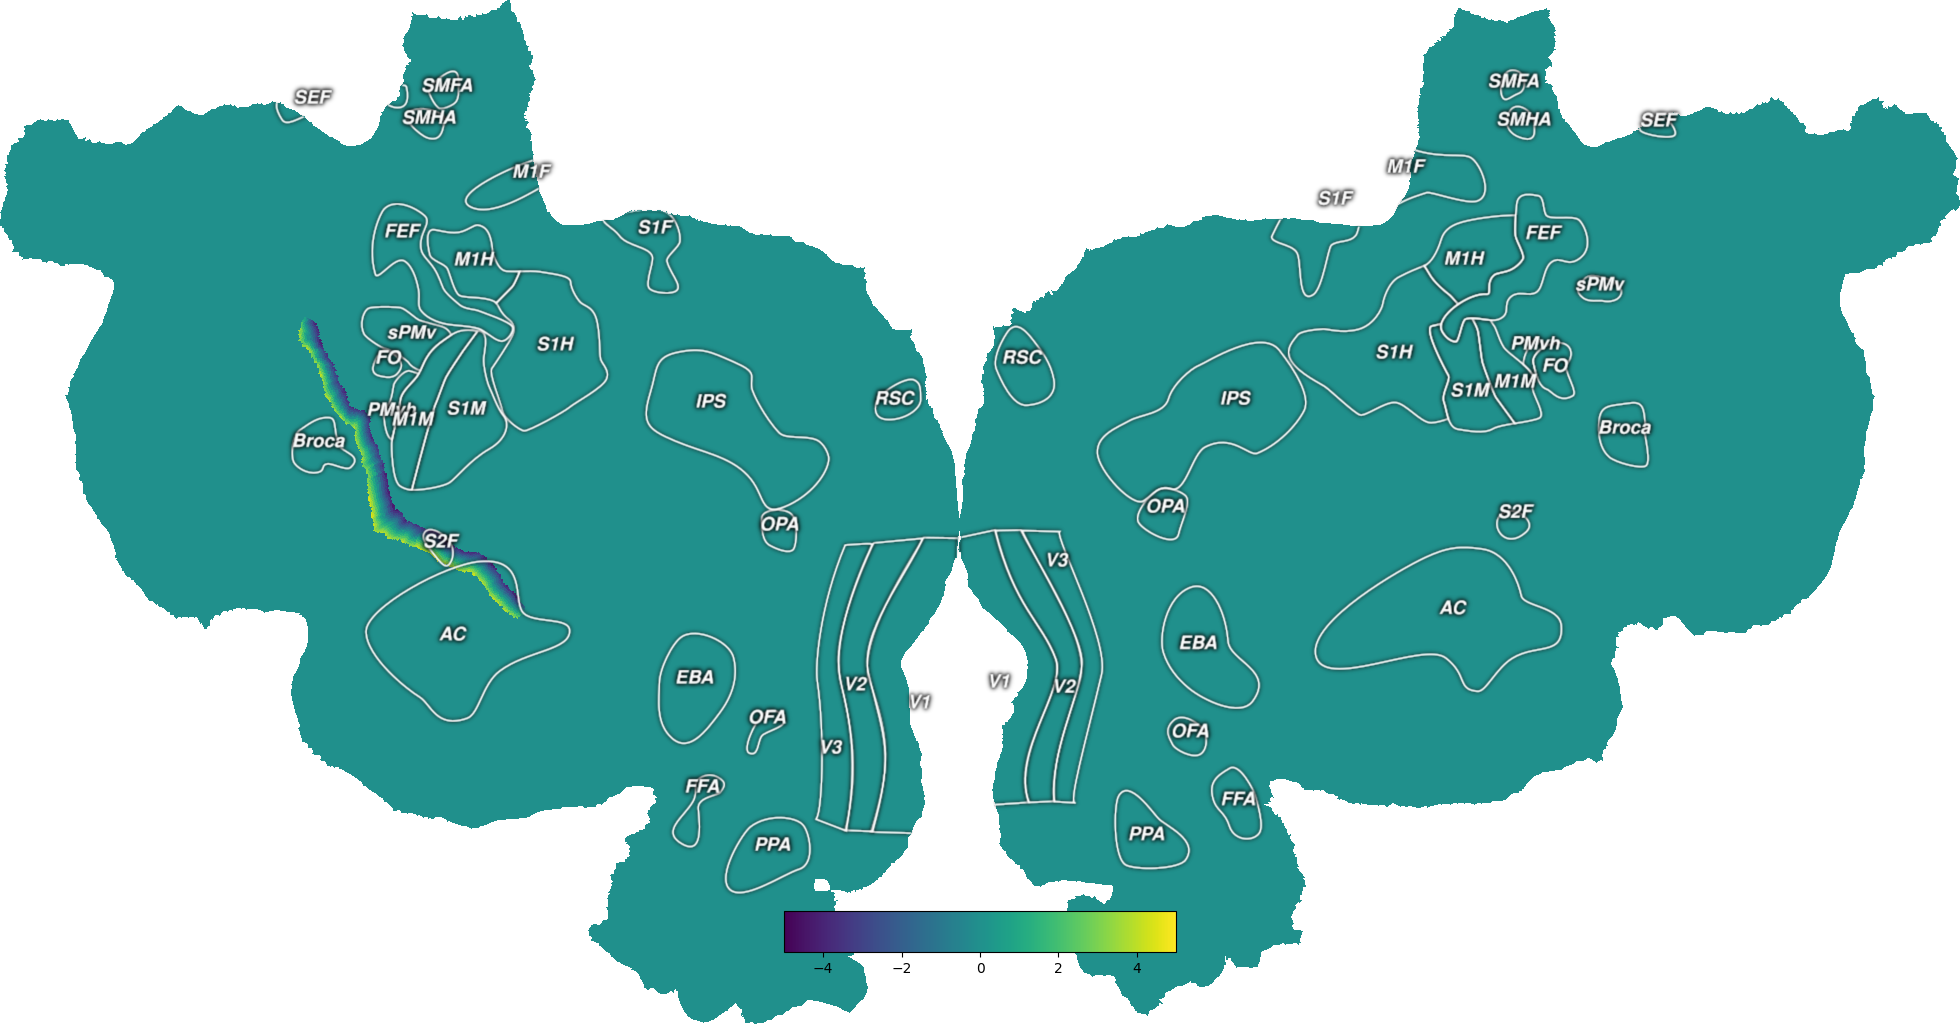
dataset = cortex.Vertex(patch['coordinates'][1, :], subject, cmap='viridis', vmin=-5, vmax=5)
cortex.quickshow(dataset)
plt.title('second coordinate, distance from central geodesic axis')
plt.show()

Background RRGGBBAA: ffffff00
Area 0:0:1960.5:1024 exported to 1960 x 1024 pixels (96 dpi)
Background RRGGBBAA: ffffff00
Area 0:0:1960.5:1024 exported to 1960 x 1024 pixels (96 dpi)
Background RRGGBBAA: ffffff00
Area 0:0:1960.5:1024 exported to 1960 x 1024 pixels (96 dpi)
Total running time of the script: (0 minutes 19.551 seconds)