Note
Go to the end to download the full example code
Plotting Geodesic Distances
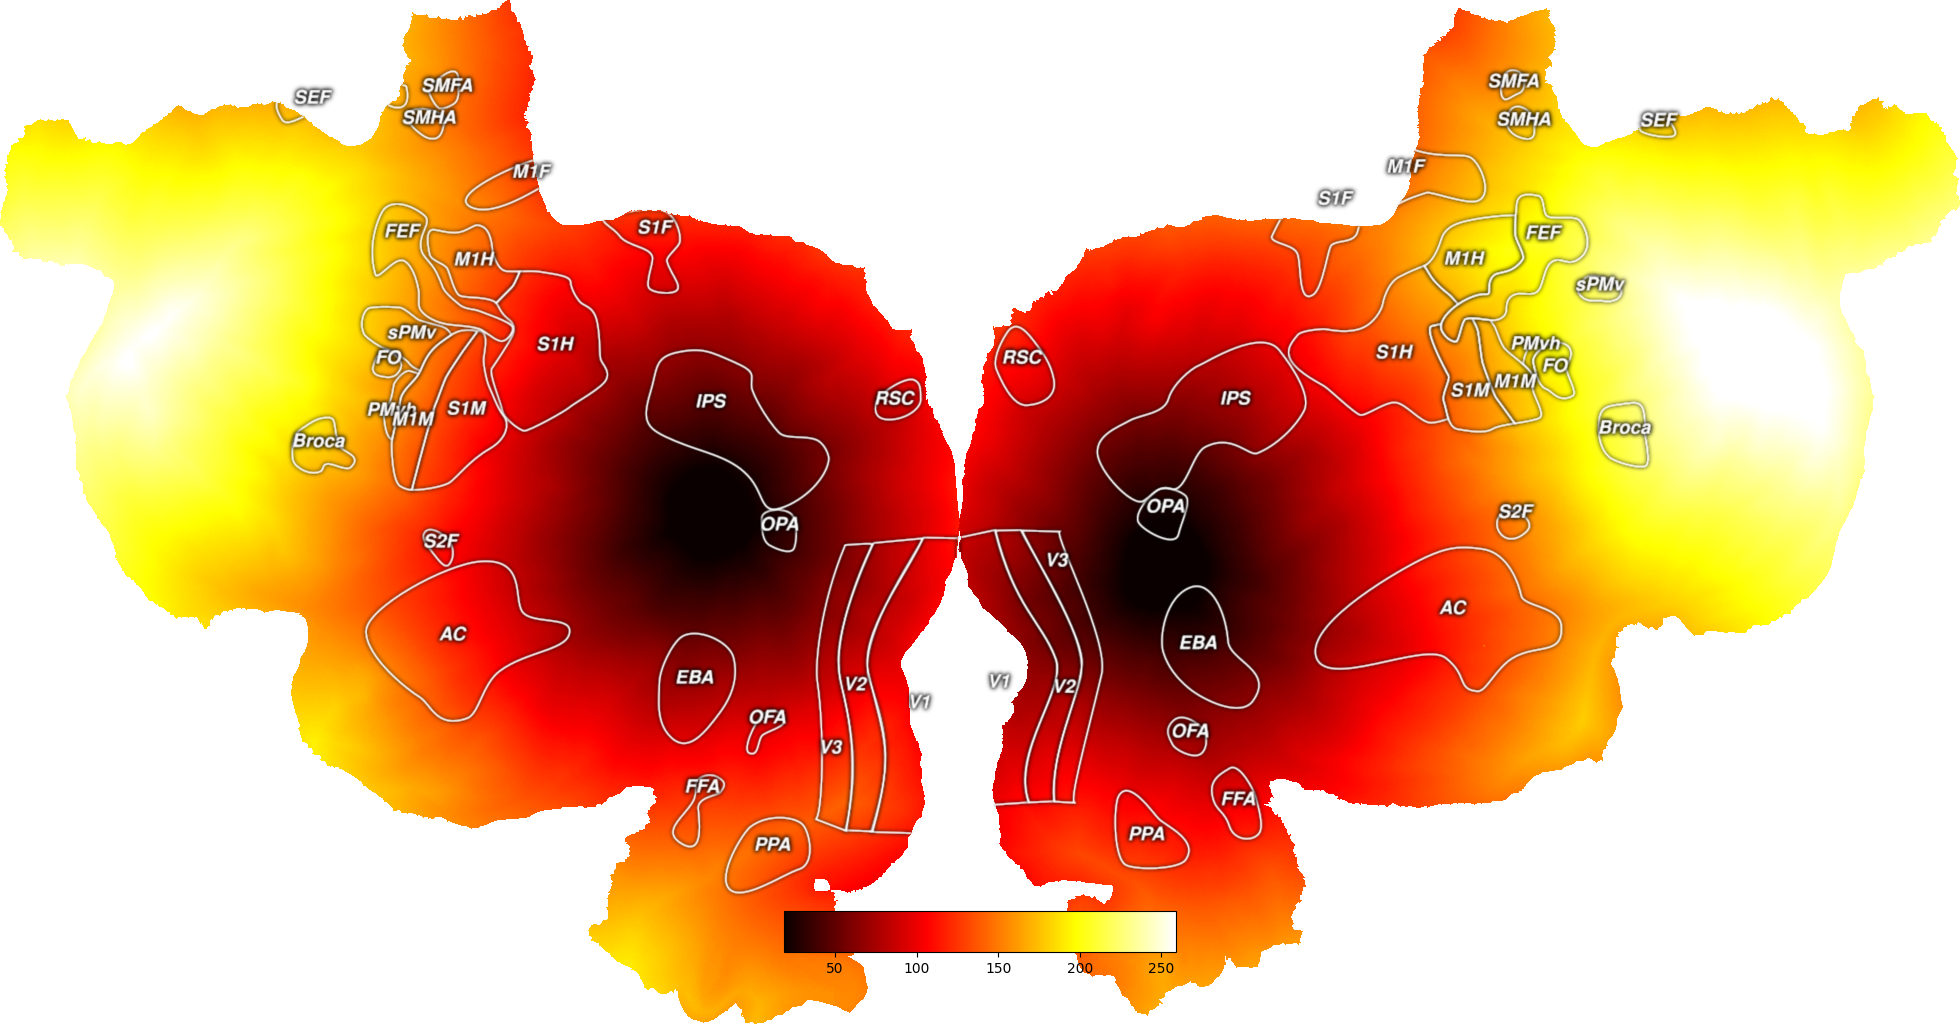
This plots the distances (in mm) between a vertex or set of vertices and all other vertices on a surface. These two operations take the exact same amount of time to run.
To look at the distance to a single point, just supply the index of that vertex. To look at the distance to a set of points, supply a numpy array of all of the vertices in the area. In the case of a set of points, the geodesic distance measure will return the minimum distance to the set of points as a whole.
The two hemispheres must be run separately.
Background RRGGBBAA: ffffff00
Area 0:0:1960.5:1024 exported to 1960 x 1024 pixels (96 dpi)
Background RRGGBBAA: ffffff00
Area 0:0:1960.5:1024 exported to 1960 x 1024 pixels (96 dpi)
import cortex
import cortex.polyutils
import numpy as np
import matplotlib.pyplot as plt
subject = "S1"
# First we need to import the surfaces for this subject
surfs = [cortex.polyutils.Surface(*d)
for d in cortex.db.get_surf(subject, "fiducial")]
# Then we will pick one vertex in each hemisphere to find distances to
vert = 10000
dists = [s.geodesic_distance(vert) for s in surfs]
# Now we can plot these distances onto a flatmap
all_dists = np.hstack((dists[0], dists[1]))
dist_map = cortex.Vertex(all_dists, subject, cmap="hot")
cortex.quickshow(dist_map)
plt.show()
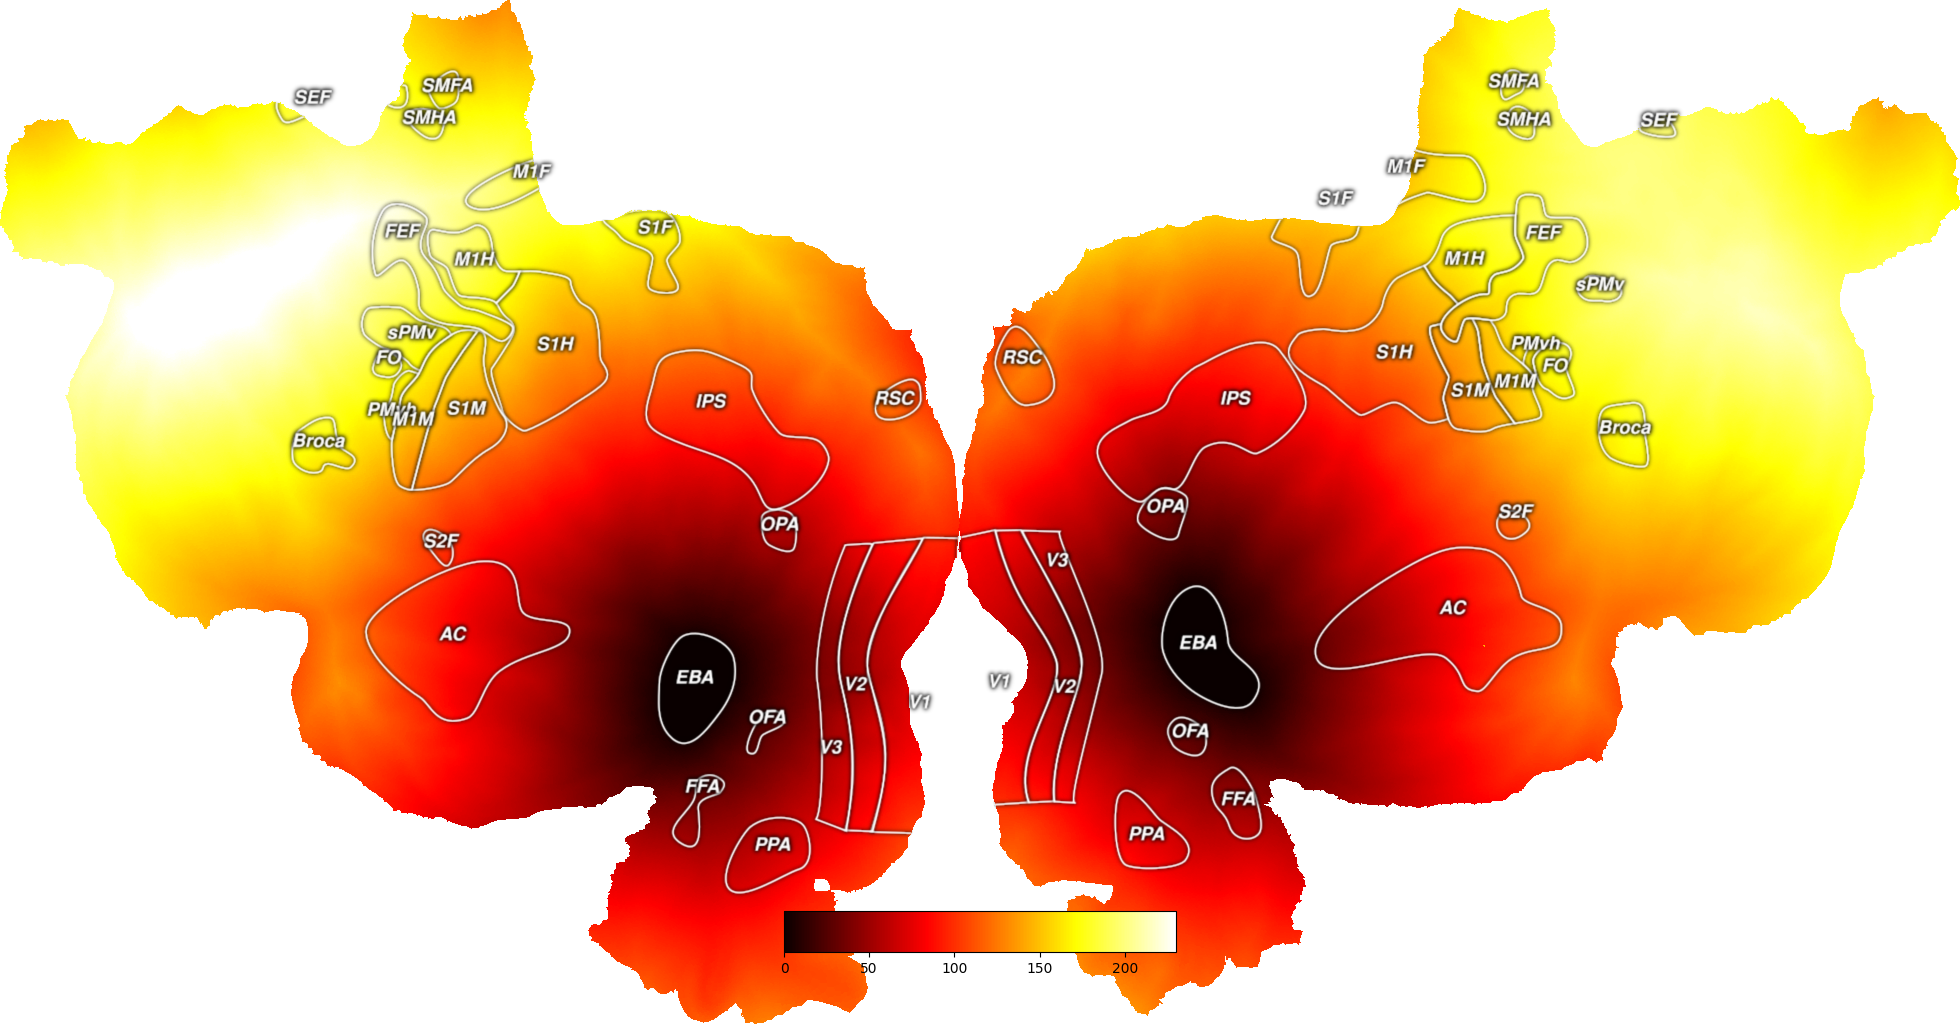
# Alternatively, you can find the minimum distance from a set of points to the
# surface
# Here, we use an example of an ROI
all_eba = cortex.utils.get_roi_verts(subject, "EBA")["EBA"]
# We have to then separate these vertices by hemisphere
numl = surfs[0].pts.shape[0]
eba_verts = [all_eba[all_eba < numl], all_eba[all_eba >= numl] - numl]
# Now look at geodesic distances for each hemisphere separately
dists = [s.geodesic_distance(verts) for s, verts in zip(surfs, eba_verts)]
all_dists = np.hstack((dists[0], dists[1]))
# And now plot these distances onto the cortical surface
dist_map = cortex.Vertex(all_dists, subject, cmap="hot")
cortex.quickshow(dist_map)
plt.show()
Total running time of the script: (0 minutes 14.610 seconds)