Note
Click here to download the full example code
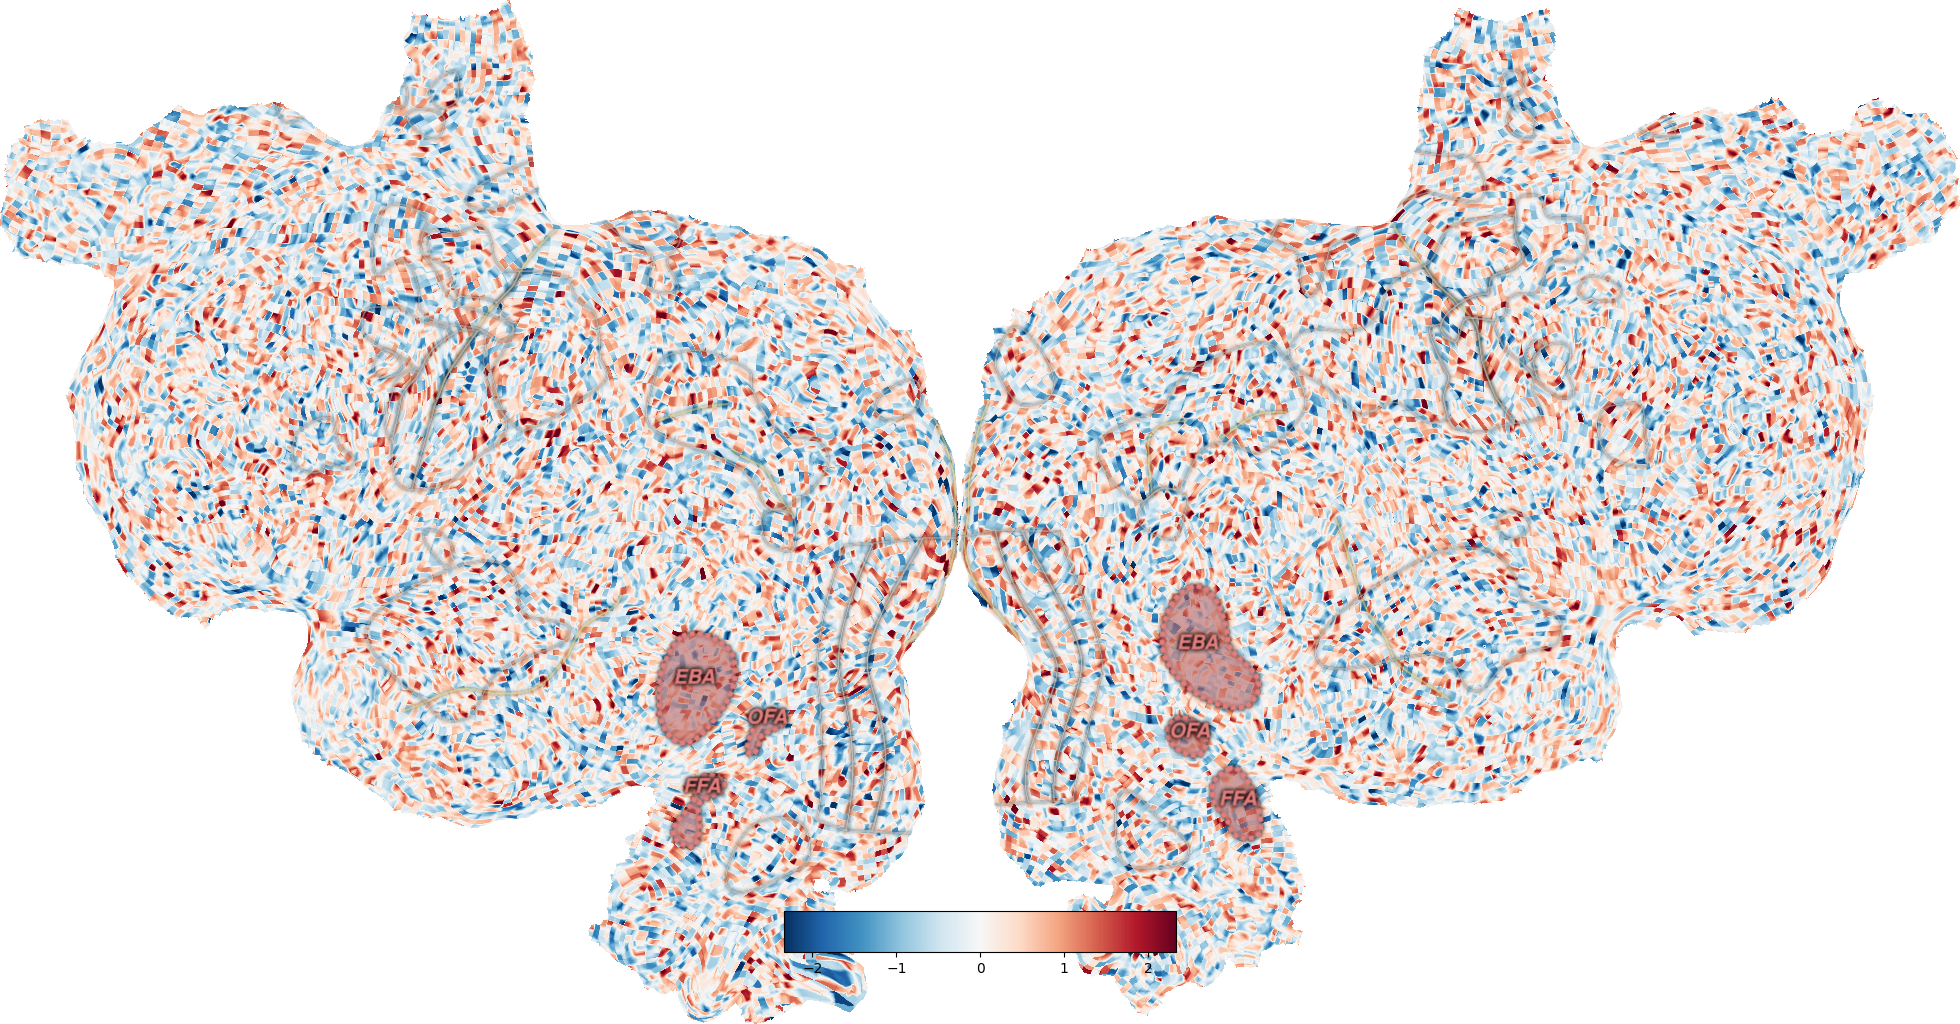
Plot with advanced compositing
The way flatmap plotting works in pycortex is to create different image layers (data, ROIs, sulci, etc) and overlay each on top of the other. Usually, quickflat.make_figure() handles all this for you, but each layer can be manipulated independently for fancier effects with the quickflat.composite sub-module.
Out:
Failed to get connection
** (inkscape:5421): CRITICAL **: 01:31:23.379: dbus_g_proxy_new_for_name: assertion 'connection != NULL' failed
** (inkscape:5421): CRITICAL **: 01:31:23.379: dbus_g_proxy_call: assertion 'DBUS_IS_G_PROXY (proxy)' failed
** (inkscape:5421): CRITICAL **: 01:31:23.379: dbus_g_connection_register_g_object: assertion 'connection != NULL' failed
Failed to get connection
** (inkscape:5424): CRITICAL **: 01:31:24.128: dbus_g_proxy_new_for_name: assertion 'connection != NULL' failed
** (inkscape:5424): CRITICAL **: 01:31:24.128: dbus_g_proxy_call: assertion 'DBUS_IS_G_PROXY (proxy)' failed
** (inkscape:5424): CRITICAL **: 01:31:24.128: dbus_g_connection_register_g_object: assertion 'connection != NULL' failed
Failed to get connection
** (inkscape:5427): CRITICAL **: 01:31:24.950: dbus_g_proxy_new_for_name: assertion 'connection != NULL' failed
** (inkscape:5427): CRITICAL **: 01:31:24.950: dbus_g_proxy_call: assertion 'DBUS_IS_G_PROXY (proxy)' failed
** (inkscape:5427): CRITICAL **: 01:31:24.950: dbus_g_connection_register_g_object: assertion 'connection != NULL' failed
import cortex
import matplotlib.pyplot as plt

# Create a random volume
volume = cortex.Volume.random(subject='S1', xfmname='fullhead')

# Create basic figure, with rois, labels, sulci all off
fig = cortex.quickflat.make_figure(volume,
                                   with_curvature=True,
                                   with_rois=False,
                                   with_labels=False,
                                   with_sulci=False)
# Add sulci in light yellow
_ = cortex.quickflat.composite.add_sulci(fig, volume,
                                         with_labels=False,
                                         linewidth=2,
                                         linecolor=(0.9, 0.85, 0.5))
# Add all rois, with a particular color scheme:
_ = cortex.quickflat.composite.add_rois(fig, volume,
                                        with_labels=False,
                                        linewidth=1,
                                        linecolor=(0.8, 0.8, 0.8))
# Highlight face- and body-selective ROIs:
_ = cortex.quickflat.composite.add_rois(fig, volume,
                                        roi_list=['FFA', 'EBA', 'OFA'],  # (This defaults to all rois if not specified)
                                        with_labels=True,
                                        linewidth=5,
                                        linecolor=(0.9, 0.5, 0.5),
                                        labelcolor=(0.9, 0.5, 0.5),
                                        labelsize=20,
                                        roifill=(0.9, 0.5, 0.5),
                                        fillalpha=0.35,
                                        dashes=(5, 3)                    # Dash length & gap btw dashes
                                        )
plt.show()
Total running time of the script: ( 0 minutes 5.141 seconds)